Wide Receiver Prop Bets and Receiving Matchups
 Available in US
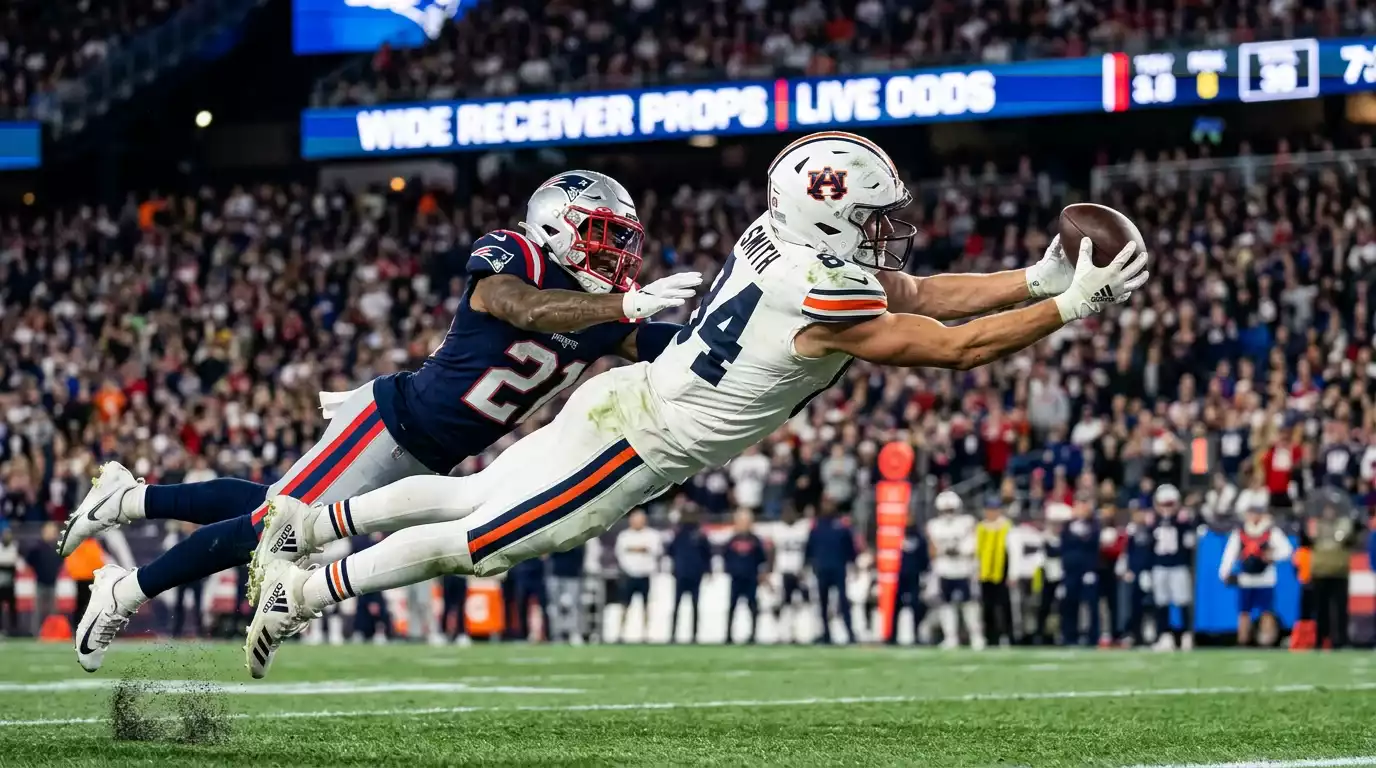
A wide receiver can run thirty routes in a game and finish with four catches for 38 yards, or he can run those same thirty routes and explode for nine catches and 142 yards. The difference usually isn’t talent – it’s opportunity, coverage, and game flow. That volatility is what makes receiver props simultaneously maddening and profitable. I’ve had weeks where receiver overs hit at a 70% clip and weeks where they cratered. The bettors who thrive in this market are the ones who understand why the variance exists and how to position themselves on the right side of it.
Receiving yards is the second-most-popular player prop market by handle, trailing only the anytime touchdown scorer according to BetMGM data. That popularity means the lines are relatively efficient – the sportsbook has ample data and public money to calibrate against. But “relatively efficient” isn’t “perfectly efficient,” and the gaps that do exist reward a specific type of analysis.
Wide Receiver Target Share and Prop Value
Early in my prop-betting career, I made the same mistake most people make with receiver props: I looked at yards per game. A receiver averaging 82 yards per game against a line of 72.5 looks like a clean over, right? Wrong, about 40% of the time. Yards per game is an output metric – it tells you what happened, not what’s likely to happen. Target share tells you what’s likely to happen.
Target share measures what percentage of the team’s total pass attempts are directed at a specific receiver. A 28% target share means roughly one in every four throws goes his way. That number is far more stable week to week than raw yardage because it reflects role and scheme rather than outcome. A receiver with a 28% target share on a team that throws 35 times per game is going to see roughly ten targets, and ten targets with even average efficiency produces a predictable yardage range.
When I evaluate a receiver prop, target share is the first number I check. If a receiver’s target share has been consistent over a four-week window, I trust the volume. If it’s been erratic – 32% one week, 18% the next – I treat the prop line with suspicion regardless of the season average. Consistency of opportunity is the bedrock of receiver prop analysis, and no amount of talent can compensate for a volatile target distribution.
One nuance: target share can shift dramatically when a teammate is injured. If the number-two receiver goes down, the number-one receiver’s target share might jump from 25% to 33% overnight. The sportsbook adjusts the line, but it often underadjusts because the models need a few games of data to recalibrate. That brief window after a significant injury to a teammate is one of the most reliable edges in receiver prop betting.
How Cornerback Matchups Shape Receiver Prop Lines
I once watched a film breakdown that showed the same receiver running identical routes against two different corners in consecutive weeks. Against a man-coverage specialist, he couldn’t get separation on six of eight attempts. Against a zone corner who lost leverage at the break, he was open on seven of nine. Same receiver, same routes, wildly different production. The matchup is the market.
For receiver props, the relevant matchup is typically the cornerback who will shadow the receiver or the zone defenders responsible for the area where the receiver runs most of his routes. Man coverage is simpler to evaluate – does the corner have the speed and technique to stay with this receiver one-on-one? Zone coverage is more complex because the responsibility shifts based on route combination and pre-snap alignment.
I use two metrics as shortcuts. First: yards per route run allowed by the opposing cornerback. This tells you how many yards the corner surrenders for every route he faces – a direct measure of how permissive or stifling the matchup is. Second: coverage snap percentage by scheme. A team that plays 70% man coverage creates different receiver props dynamics than one playing 70% zone.
The public largely ignores cornerback matchups because the information requires more digging than a casual bettor is willing to do. That informational gap is exactly why the edge exists. If you’re going to specialise in one area of NFL prop analysis, receiver-versus-corner matchups offer some of the most consistent returns I’ve found over nine seasons.
Air Yards as a Leading Indicator for Receiving Props
Air yards – the total distance a pass travels before being caught or falling incomplete – is a leading indicator that most prop bettors haven’t incorporated into their process yet. While target share tells you how often a receiver is targeted, air yards tell you how far downfield those targets are. A receiver with a high air yards share is being used as a deep threat, which means his yardage output has a higher ceiling and a lower floor than a possession receiver who catches short passes underneath.
Unders on NFL player props hit roughly 60% of the time according to CBS Sports data, and deep-threat receivers are a big reason why. Their yardage distribution is bimodal – they either break a long catch and exceed the line easily, or they finish with two catches for 28 yards because the deep shots didn’t connect. The sportsbook often sets the line near the statistical average, which sits in the valley between those two outcomes. If you’re betting a deep-threat receiver’s yardage prop, you’re implicitly betting on which mode shows up.
For possession receivers who work the short-to-intermediate zones, air yards per target is lower but the catch rate is higher. Their yardage distribution clusters more tightly around the average, making the prop line a fairer representation of likely outcomes. I find more value on overs for possession receivers in positive game scripts and more value on unders for deep-threat receivers in negative ones – a framework that’s simple enough to apply quickly but granular enough to outperform a coin flip.
Pairing air yards analysis with tight end prop evaluation gives you a more complete picture of where the passing volume is directed, since tight ends and receivers often compete for the same intermediate targets.
Does a wide receiver’s route tree affect which prop bets offer value?
Yes. Receivers with diverse route trees tend to produce more consistent yardage because they aren’t dependent on one type of throw. Receivers who primarily run deep routes have higher variance – big games or quiet ones, with less middle ground. Match the route profile to the prop type: consistent route runners suit over/under plays, while deep threats create value on overs only in specific matchups.
How do slot receivers and outside receivers differ for prop betting purposes?
Slot receivers typically face softer coverage from nickel defenders and accumulate shorter, higher-volume catches. Their yardage output is steadier and their props are priced more tightly. Outside receivers face top cornerbacks more often, producing more volatile results. The edge for slot receivers often lies in reception count props rather than yardage, while outside receivers offer more value in yardage props when the cornerback matchup is favourable.
Published by the nfl Best Player Prop Bets team.