NFL Defence Rankings for Prop Betting
 Available in US
Every prop bettor eventually reaches the same realisation: the player is only half the equation. The defence he faces is the other half, and in some cases, it’s the bigger half. I spent my first two years of serious prop analysis focused almost entirely on offensive players – their averages, their trends, their talent. My results were mediocre. The season I started weighting defensive matchup data equally in my process was the season my tracking spreadsheet turned consistently green.
The challenge is knowing which defensive metrics actually matter. The NFL produces mountains of data, and not all of it is useful for prop purposes. Some statistics are descriptive – they tell you what happened. Others are predictive – they tell you what’s likely to happen next. The gap between those two categories is where the average bettor gets lost and the informed bettor finds value.
Pass Defence Metrics Impacting Player Props
The average sportsbook hold percentage has climbed from 6.7% in 2018 to above 9% in recent years, per Doc’s Sports analysis. That means sportsbooks are getting better at pricing, and you need sharper inputs to stay ahead. Pass defence metrics are the sharpest input I’ve found for quarterback and receiver props.
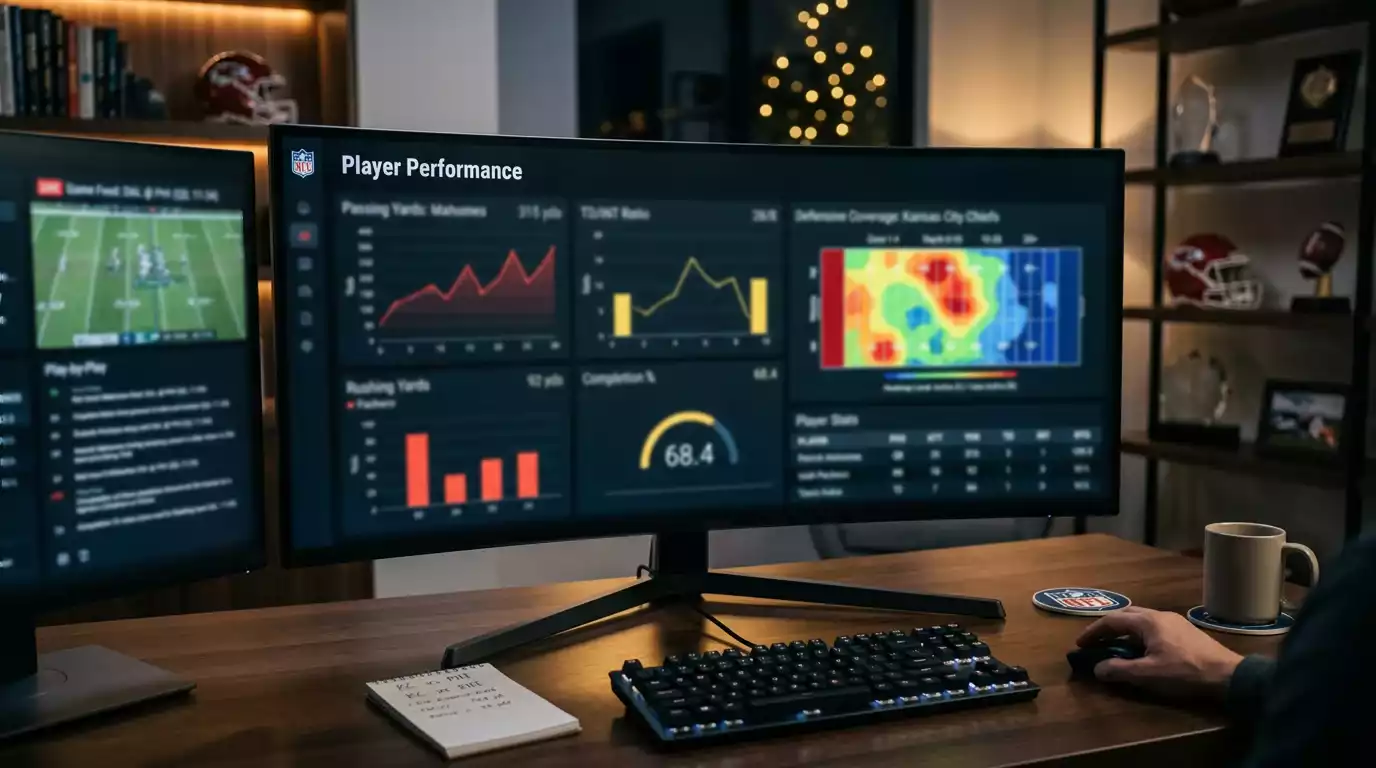
DVOA – Defence-adjusted Value Over Average, published by Football Outsiders – is the metric I start with. It measures defensive efficiency adjusted for opponent strength and game situation. A defence ranked third in pass DVOA is genuinely good against the pass, accounting for the quality of quarterbacks it has faced. A defence ranked third in raw passing yards allowed might simply have played poor quarterbacks. DVOA strips out that noise.
Pressure rate is the second metric I check. Defences that generate pressure on the quarterback at a rate above 30% tend to suppress passing props across the board – fewer completions, shorter throws, more hurried decisions. When a strong-pressure defence faces a quarterback who struggles under duress, the passing yards under becomes one of the most reliable bets on the board.
Yards allowed per pass attempt is the third metric, and it’s the simplest. It tells you how many yards the defence surrenders per throw. The league average hovers around seven. If a defence allows 8.5 yards per attempt, passing props against them should skew toward overs. Below 6.0, the under has structural support.
Rush Defence Rankings and Running Back Props
Rush defence is a different analytical animal. Passing efficiency is driven largely by the quarterback, but rushing efficiency depends heavily on the offensive line and the defensive front working in tandem. The individual running back matters less than people think, and the defence matters more.
Yards before contact is the metric I lean on most for running back props. It measures how many yards a running back gains before a defender touches him – essentially quantifying the offensive line’s performance. When a strong offensive line faces a weak defensive front, yards before contact spike, and the rushing props over becomes attractive regardless of which specific back is carrying the ball.
Unders on player props hit around 60% of the time across multiple NFL seasons per CBS Sports tracking, and running back rushing yards contribute heavily to that number. The public bets overs on feature backs whose highlight reels suggest dominance. The reality is that defensive fronts control the run game at a structural level, and a back facing a top-five rush defence is fighting gravity.
Stuff rate – the percentage of runs stopped at or behind the line of scrimmage – is the final piece. A defence with a high stuff rate doesn’t just limit yards; it creates negative plays that pull the average down. When a team with a high stuff rate faces a back who relies on volume rather than explosive plays, the under on rushing yards carries an edge the line often doesn’t fully reflect.
Man Coverage vs Zone: How Defensive Scheme Shapes Props
Scheme is the variable that separates prop bettors who use basic stats from those who think in systems. A defence can rank identically in yards allowed per game but operate in completely different ways depending on whether it plays predominantly man coverage or zone coverage. Those two approaches create different prop landscapes for every offensive player.
Man coverage isolates one defender against one receiver. It tends to produce binary outcomes: the receiver either beats his man and gains significant yards, or he doesn’t and the play stalls. Props against man-heavy defences have higher variance, which means the over and under are both plausible depending on the specific receiver-cornerback pairing. I evaluate these matchups at the individual level – speed differentials, route-running grades, and press-coverage success rates.
Zone coverage distributes responsibility across areas of the field. It tends to allow shorter completions between zone defenders while limiting explosive plays. Against zone-heavy defences, possession receivers thrive because they find soft spots in the coverage and accumulate yards in five-to-twelve-yard chunks. Deep threats struggle because the safety help over the top takes away the big play. If you’re betting a slot receiver’s yardage against a zone defence, the over has structural support. If you’re betting a deep threat against the same defence, the under is usually the sharper side.
Tracking a team’s coverage distribution – what percentage of snaps they spend in man versus zone – is one of the highest-leverage data points for receiver props. It takes time to gather, but it’s the kind of informational advantage that compounds across a full season. When you combine scheme data with personnel data – who is actually on the field in each coverage package – you get a granular picture of the defensive environment that no simple ranking can capture.
One common mistake I see: treating defensive scheme as static. Coordinators adjust week to week based on the opposing offence. A team that played 65% man coverage all season might shift to 70% zone against an offence with elite speed on the outside. If you only check season-long averages, you’ll miss these game-specific adjustments. I look at the three most recent games as a rolling window alongside the season totals – that balance captures both the baseline tendency and the recent trend. For a deeper dive into how these matchup principles apply to specific positions, the analysis of quarterback prop bets covers how pass defence and blitz rates directly shape QB lines.
Which single defensive metric is most predictive for player prop outcomes?
DVOA from Football Outsiders is the most broadly predictive single metric because it adjusts for opponent quality and game situation. For passing props specifically, pressure rate adds significant predictive power. No single number captures everything, but DVOA plus pressure rate covers most of the ground for quarterback and receiver props.
How quickly should I adjust my matchup analysis when a team changes defensive coordinator?
Scheme changes under a new coordinator typically take three to four games to stabilise. During those initial weeks, historical defensive data becomes unreliable because the scheme is in transition. I wait until a new coordinator has at least three full games of film before trusting that team’s defensive metrics for prop analysis. Early-season coordinator changes create a data void that favours caution.
Created by the ”nfl Best Player Prop Bets” editorial team.