NFL Prop Bet Records Tracking and ROI
 Available in US
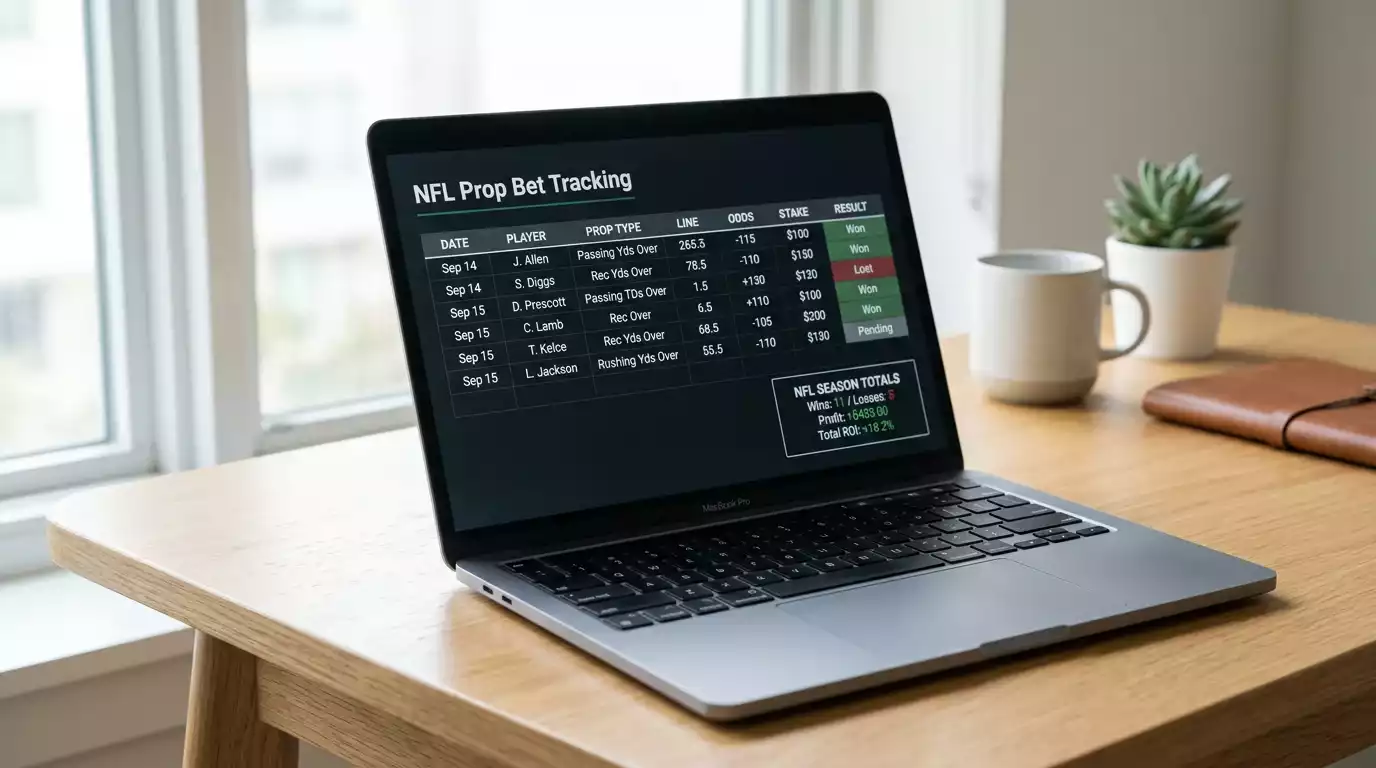
For the first two seasons I bet on NFL props, I kept no records. I had a vague sense that I was winning some weeks and losing others, but I couldn’t tell you my actual ROI, my hit rate by prop type, or whether my quarterback picks were subsidising my losses on running back props. When I finally built a tracking spreadsheet in my third season, the first month of data revealed something uncomfortable: I was winning 52% of my bets but losing money overall because I was overweighting parlays and underweighting the vig. Without the log, I would have continued believing I was profitable. With it, I could identify the leak and fix it.
The average sportsbook hold has climbed above 9% per Doc’s Sports analysis, which means the margin for error is thinner than ever. Tracking your bets isn’t optional if you’re serious about long-term profitability. It’s the diagnostic tool that turns a gambling habit into a structured process.
Essential Metrics for NFL Prop Bet Logging
My spreadsheet has twelve columns, and filling them takes less than two minutes per bet. The discipline is in doing it every time – not just the wins, not just the interesting ones, but every single wager.
The essential columns: date, game, player, prop type (passing yards, rushing yards, anytime TD, etc.), the line (265.5, 0.5, etc.), the side you took (over/under), the odds at the time of your bet, the closing odds (the final price before kickoff), the actual result, and the outcome (win/loss). Beyond those, I track the sportsbook where I placed the bet and a brief note on my reasoning – one sentence explaining why I took this prop.
The reasoning column is the most valuable in the long run. After a hundred bets, you can filter by reasoning type – “matchup edge,” “injury-driven,” “weather play,” “contrarian fade” – and see which analytical approaches actually produce positive results and which ones feel clever but lose money. My contrarian fades, for example, performed well for three seasons and then stopped working when sportsbook models got better at pricing public bias. Without the tracking data, I would have continued fading the public out of habit long after the edge disappeared.
One column that most bettors skip but I consider essential: closing line value. Record the odds at the time you placed your bet and the odds at kickoff. The difference tells you whether you consistently get better prices than the market’s final assessment. Sportsbooks hold 4 – 6% on single bets per BettorEdge analysis, and positive CLV over time means you’re consistently finding prices where the implied probability understates the true likelihood of your selection hitting.
ROI, CLV, and Win Rate: Which Metric Tells the Truth
Win rate is the metric everyone checks first and the one that lies most often. A 55% win rate sounds profitable, but if your average bet is at -120 (1.83 decimal), you need 55.5% just to break even. Your 55% rate is actually losing money. Conversely, a 47% win rate at average odds of +110 (2.10 decimal) is profitable because the payout compensates for the lower hit rate. Win rate without odds context is meaningless.
ROI – return on investment – is a better measure because it incorporates both win rate and odds. It tells you how much profit you’ve generated per pound wagered. A 5% ROI means you’ve earned five pence for every pound risked. Over a season of 300 prop bets at £20 per bet (£6,000 total wagered), a 5% ROI produces £300 in profit. That sounds modest, and it is. Realistic prop betting returns are modest. Anyone claiming 15-20% ROI over a meaningful sample is either exceptionally skilled, working with a small sample size, or not being honest.
Closing line value is the metric that professional bettors trust most, and it’s the one I weight heaviest in my own analysis. CLV measures whether you consistently beat the closing line – the final price the market settles on after absorbing all available information. If you bet a prop at 1.95 and it closes at 1.85, you got a better price than the efficient market determined was fair. Positive CLV, sustained over hundreds of bets, is the strongest evidence that your process is sound – regardless of short-term win/loss fluctuations.
How Many Bets Before Your Results Mean Something
Variance in prop betting is brutal. A skilled bettor with a genuine 3% edge can easily have a losing month. Two losing months in a row is uncommon but not rare. The question of when your results become statistically meaningful – when the signal emerges from the noise – depends on the size of your edge and the variance of the markets you bet.
The rough benchmark I use: 300 bets at similar stakes is the minimum sample size for evaluating a prop betting strategy. Below that, variance dominates. Your win rate might be five percentage points above or below its true level purely by chance. At 300 bets, the confidence interval narrows enough that a genuine edge of 3-5% starts to become visible in the data.
For a UK bettor placing five to eight props per NFL Sunday across an eighteen-week season, that’s roughly 90-144 bets per year. It takes two full seasons of consistent betting to accumulate a meaningful sample. The implication is sobering: you need to bet for two years before you can confidently assess whether your approach works. Patience isn’t a virtue in prop betting – it’s a requirement.
During those two years, the tracking log is your navigation instrument. It tells you whether your process is generating positive CLV even when results are negative. It reveals which prop types and positions produce your strongest results. It exposes the behavioural patterns – chasing losses, overcommitting to parlays, ignoring vig – that erode your edge. Without the log, you’re navigating by feel, and feel is not a reliable compass across 300 bets. For the staking plan that keeps you solvent while you accumulate that sample, the NFL prop betting strategy guide outlines the systematic approach to selecting and sizing each bet.
How many NFL prop bets do I need to track before evaluating my strategy?
A minimum of 300 bets at similar stake sizes provides a meaningful sample for evaluation. Below that threshold, variance dominates the results and your win rate or ROI may not reflect your true skill level. For a typical UK bettor placing five to eight props per week during the NFL season, reaching 300 bets requires roughly two full seasons of consistent tracking.
Is win rate or ROI a better measure of prop betting success?
ROI is more informative because it accounts for both the frequency of winning and the odds at which you win. A high win rate at short odds can produce a negative ROI, while a moderate win rate at longer odds can be profitable. Closing line value is arguably the best single metric — it measures whether you consistently find better prices than the efficient market, which correlates strongly with long-term profitability.
Created by the ”nfl Best Player Prop Bets” editorial team.